Today

21

temperature

Forecast at 17:00

2.46°C


Rain: 0.0 mm

Forecast at 18:00

-1.22°C

Rain: 0.0 mm

Forecast at 19:00

-2.86°C

Rain: 0.0 mm

Forecast at 20:00

-3.65°C

Rain: 0.0 mm

Highest and lowest measured temperatures by year


More statistics

Random photo of the month:

Diagrams

Last 24 h

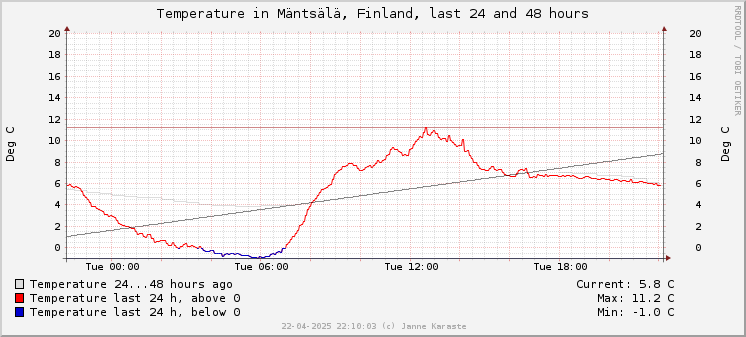
The diagram shows temperature variations during the last 24 hours in Celsius scale. Positive temperatures are in red and subzero are in blue. On the background, light grey plot is the last 24 - 48 hours, essentially answering the question "what was the temperature yesterday at this time?". Black line is trend line.

Last 7 days

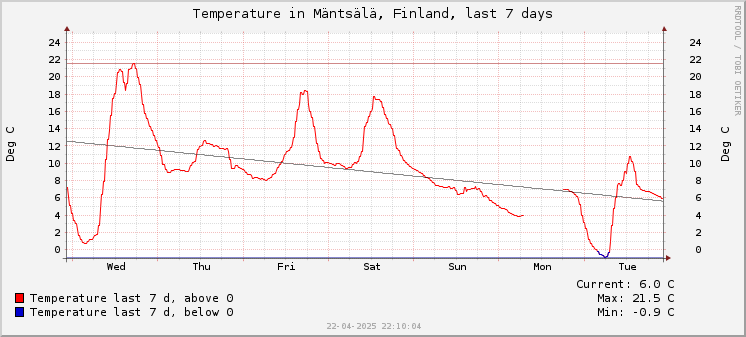
The diagram shows temperature variations during the last 7 days in Celsius scale. Positive temperatures are in red and subzero are in blue. Black line is trend line. Please note that measurement accuracy decreases when looking at diagrams longer than 24 hours.

Last 30 days

The diagram shows temperature variations during the last 30 days in Celsius scale. Positive temperatures are in red and subzero are in blue. Black line is trend line. Please note that measurement accuracy decreases when looking at diagrams longer than 24 hours.

Wind speed last 24 hours

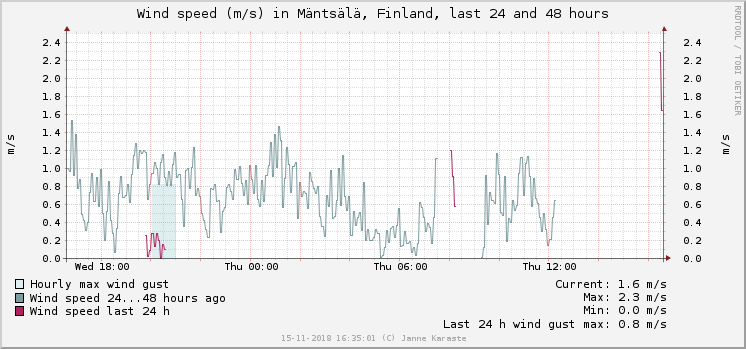
Purple plot depicts wind speed variations during the last 24 hours. Dark blue plot shows wind speed yesterday. Light blue background shows highest wind gust speed (highest m/s during one hour measurement interval).

Equipment

Measurement devices and software

Measurements are done using Raspberry Pi computers, Arduino platform and external sensors. More detailed equipment page has not yet been completed.

Features

Completed features and under development

  • Temperature measurements
  • Temperature plots
  • Temperature history data
  • Forecasts

  • Wind speed measurements
  • Sunlight intensity
  • Rainfall measurements

Follow in Twitter

Fully automatic temperature tweeting bot!